
Fractals
WHAT ARE FRACTALS?
The term fractal was coined by the mathematician Benoit Mandelbrot in 1975. In his seminal work The Fractal Geometry of Nature, he defines a fractal as “a rough or fragmented geometric shape that can be split into parts, each of which is (at least approximately) a reduced-size copy of the whole.”
A fractal is a never-ending pattern.


A fractal is a pattern that the laws of nature repeat at different scales. Examples are everywhere in the forest. Trees are natural fractals, patterns that repeat smaller and smaller copies of themselves to create the biodiversity of a forest.
Sa madaling salita ang fractal ay pattern na nauulit. Yan lang need mo tandaan. Pattern na nauulit mula sa malaki papuntang maliit. Regardless ng size niya ganun pa rin yung pattern.
Maraming halimbawa ng fractals gaya ng trees, rivers, coastlines, mountains, clouds, seashells, hurricanes, etc.


IN TRADING
Williams fractal or fractals is a technical analysis indicator introduced by the famous trader Bill Williams in his book “Trading Chaos”. The indicator is centred around the idea that there is repetition in price behaviour and fractals can provide an insight into the repetition patterns.
Pinagsama ni Mr. Williams ang chaos theory at psychology.
Fractals are indicators on candlestick charts that identify reversal points in the market.
Mayroong Bearish Fractal at mayroong Bullish Fractal.
FORMULA
Bearish fractals
Bearish Fractal= High(N)>High(N−2) and
High(N)>High(N−1)
and High(N)>High(N+1) and
High(N)>High(N+2)
Where: N=High of the current price bar
N−2=High of price bar two periods
to the left of N
N−1=High of price bar one period
to the left of N
N+1=High of price bar one period
to the right of N
N+2=High of price bar two periods
to the right of N


Bullish fractals
Bullish Fractal= Low(N)<Low(N−2) and
Low(N)<Low(N−1) and
Low(N)<Low(N+1) and
Low(N)<Low(N+2)
Where: N=low of the current price bar
N−2=low of price bar two periods
to the left of N
N−1=low of price bar one period
to the left of N
N+1=low of price bar one period
to the right of N
N+2=low of price bar two periods
to the right of N

Confusing ano? Haha.
Lets simplify it.
Bearish Fractals

Bawat daliri kunyare ay candles.

5 daliri diba? 5 araw kaya 5 candles assuming na Day ang timeframe na gamit natin.

Yung gitnang daliri yung highest candle.
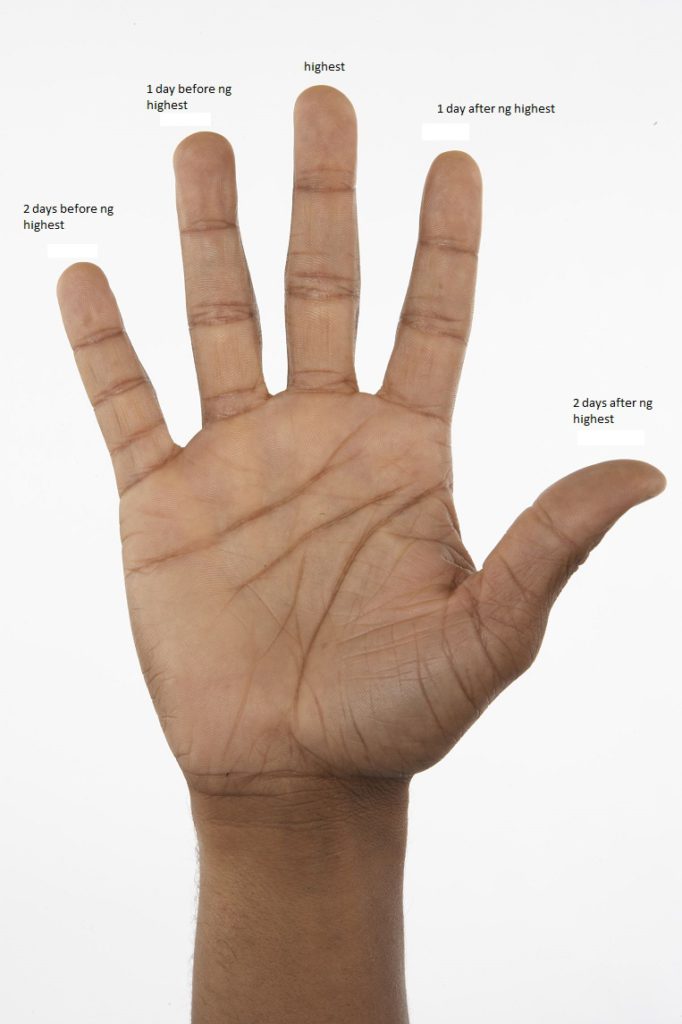
Instead na words palitan natin ng letters at symbol para shortcut.

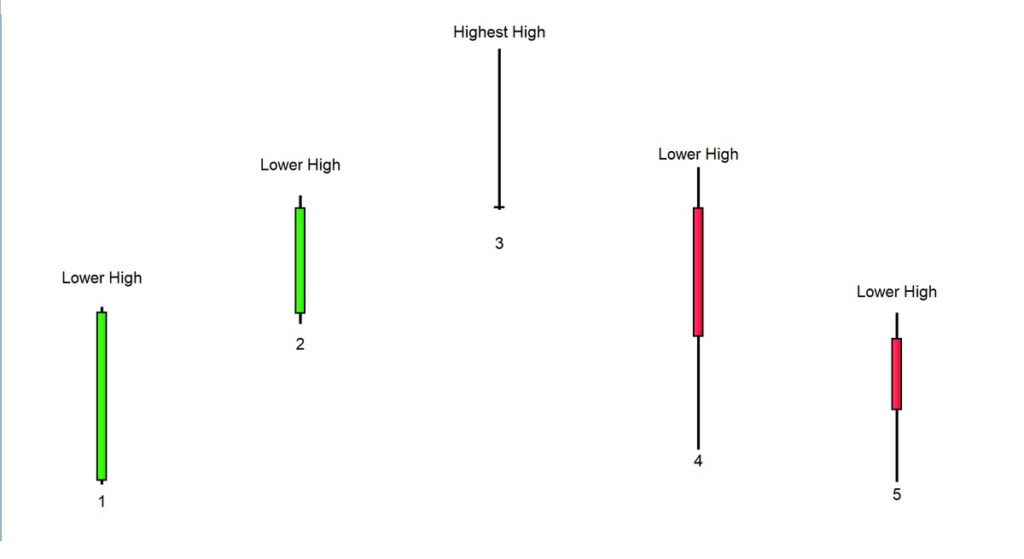
Ang tawag diyan sa example na yan ay Bearish Fractals.
Oh balikan natin ang formula ha.
Bearish Fractal= High(N)>High(N−2) and
High(N)>High(N−1)
and High(N)>High(N+1) and
High(N)>High(N+2)
Where: N=High of the current price bar
N−2=High of price bar two periods
to the left of N
N−1=High of price bar one period
to the left of N
N+1=High of price bar one period
to the right of N
N+2=High of price bar two periods
to the right of N
Mas naintindihan ninyo noh?


Ang Bearish fractals ay yung dalawang candle before and after ng middle candle ay mas mababa sa kanya yung high.
Kaya siya bearish kasi meaning nito pabagsak na ang price.
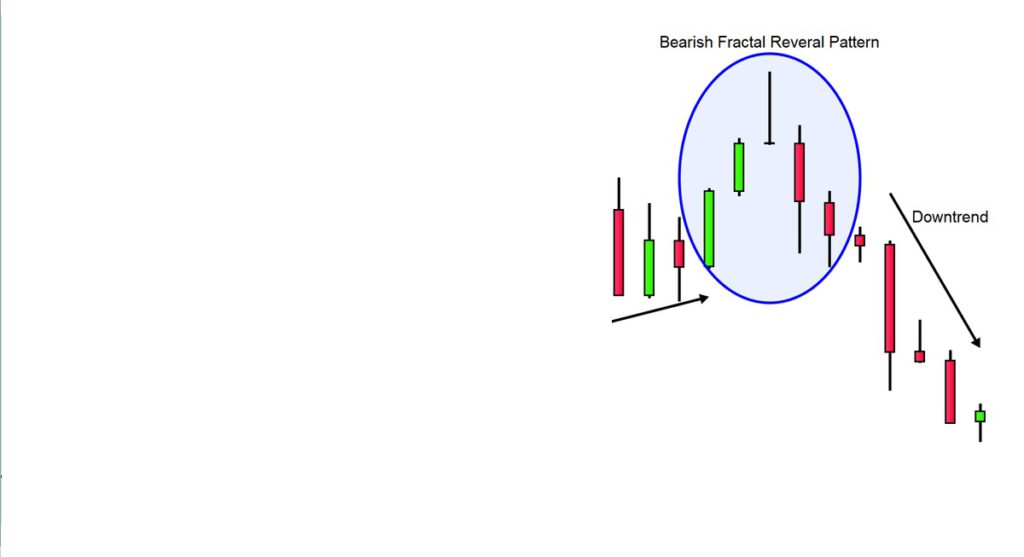
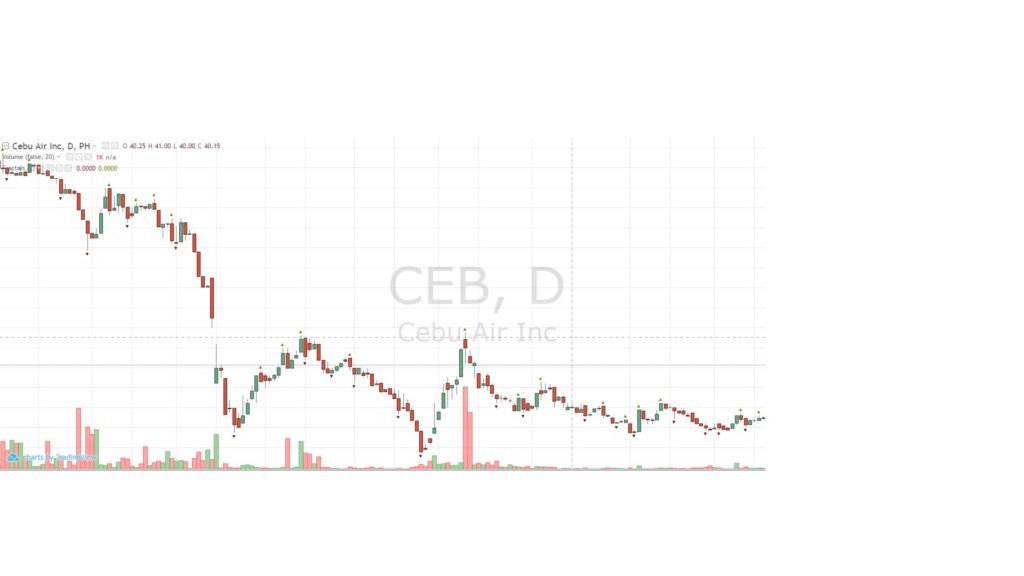
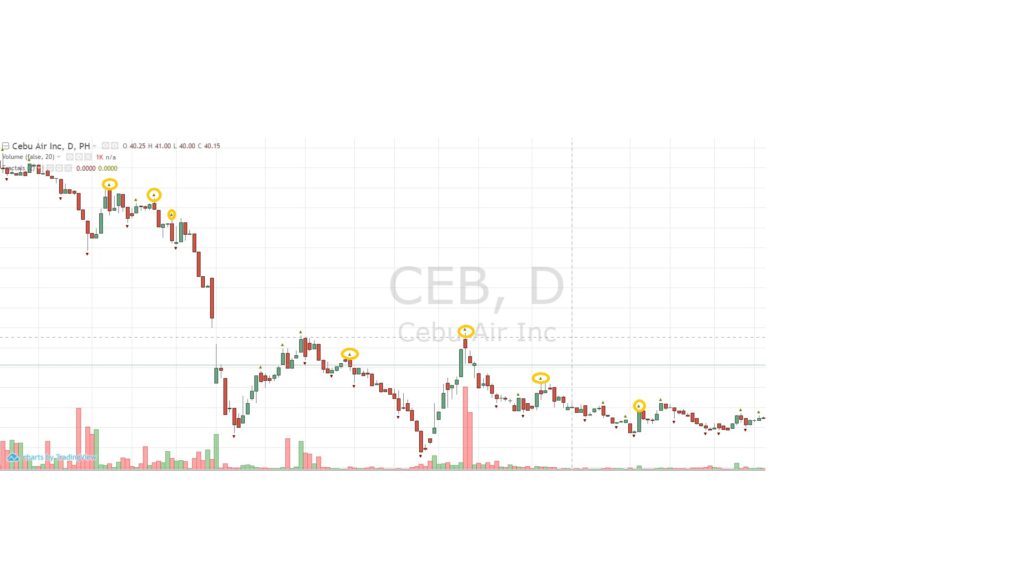
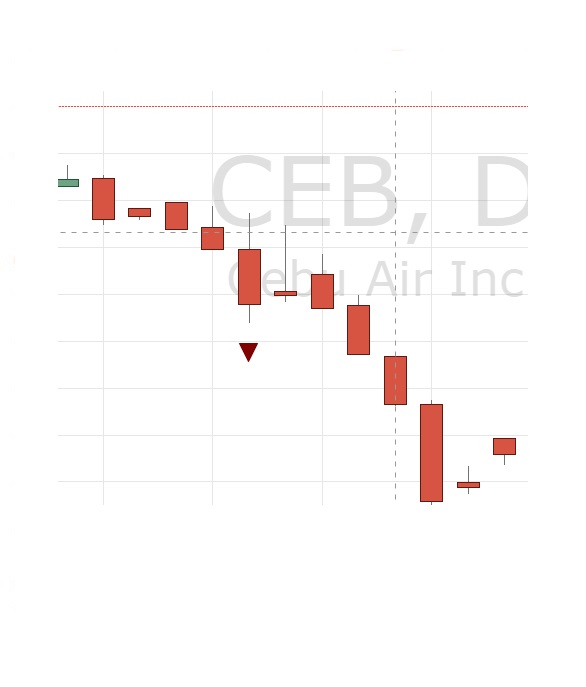
Sa chart ganito labas niyan. Plot nyo yung Williams Fractals.
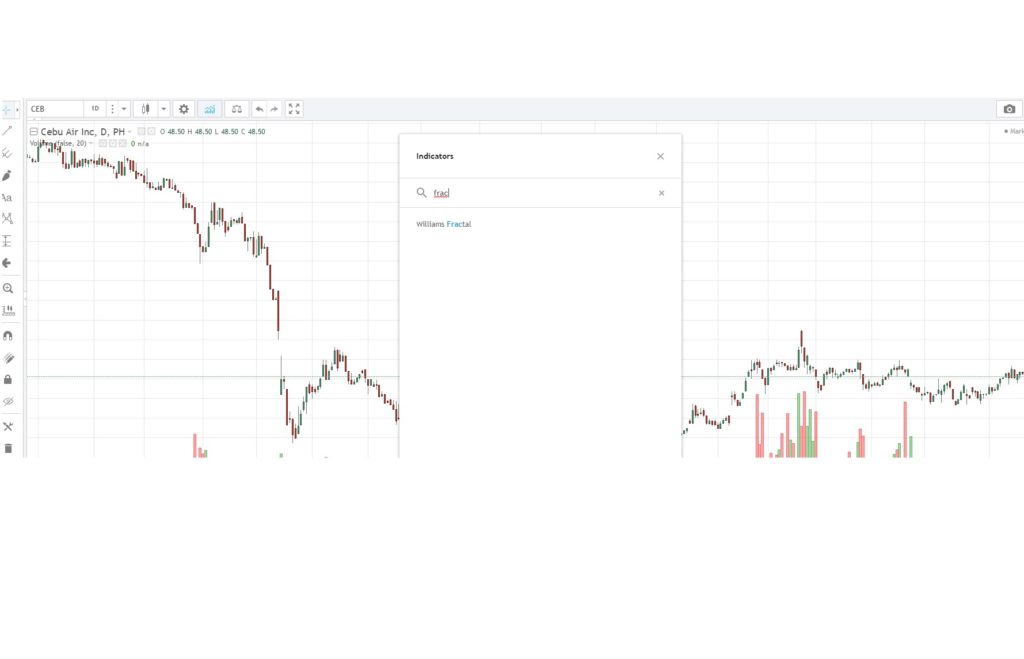
May green na arrow pataas sa middle candle. Yan ang fractals sa chart. Bearish fractals ibig sabihin ng arrow sa taas ng candel. Meaning yung high ng middle candle ay mas mataas kesa dun sa high ng dalawang candle before niya at after niya.
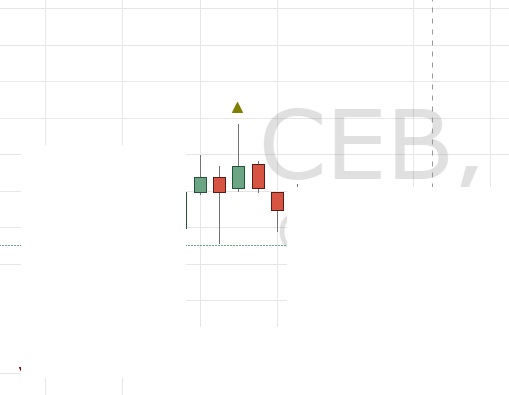
Dahil bearish fractals ang result is bumagsak price.
BULLISH FRACTALS
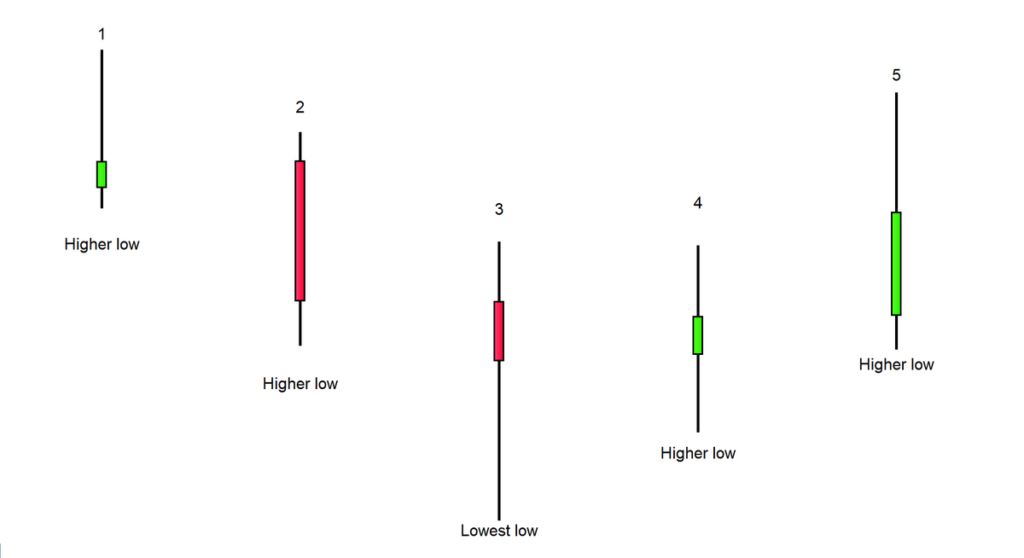
Sa bullish naman simplehan din natin. Lagay natin kamay.

Ay mali. Ulit.

Yung kamay na yan kunyare bawat daliri eh isang candle. Limang candle. Limang araw kasi isang araw eh isang candle if Day yung timeframe.


Look nyo again yung formula.
Bullish Fractal= Low(N)<Low(N−2) and
Low(N)<Low(N−1) and
Low(N)<Low(N+1) and
Low(N)<Low(N+2)
Where: N=low of the current price bar
N−2=low of price bar two periods
to the left of N
N−1=low of price bar one period
to the left of N
N+1=low of price bar one period
to the right of N
N+2=low of price bar two periods
to the right of N
Mas malinaw na diba?

Ang Bullish fractals ay yung dalawang candle before and after ng middle candle ay mas mataas ang low.
Kaya siya bullish kasi meaning nito paakyat na ang price .
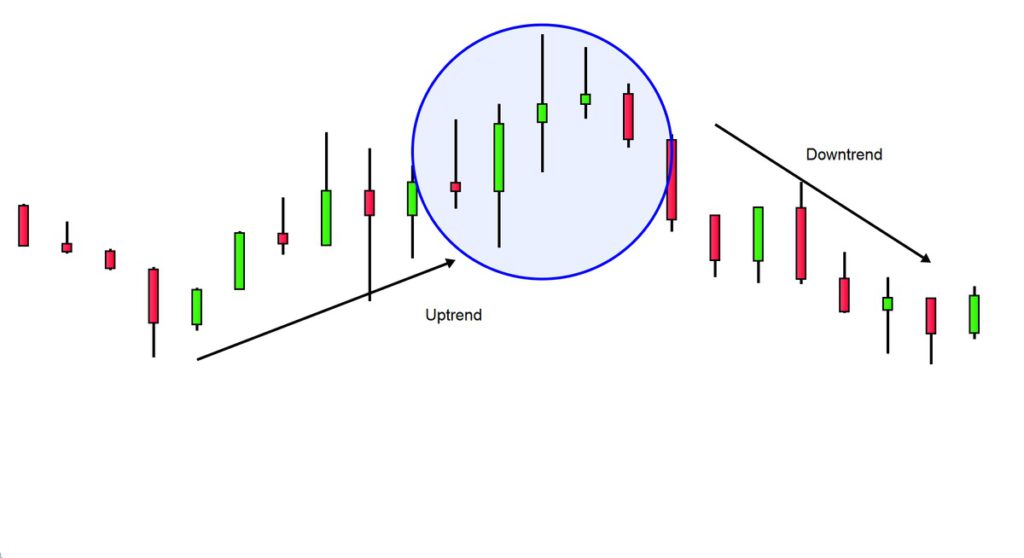
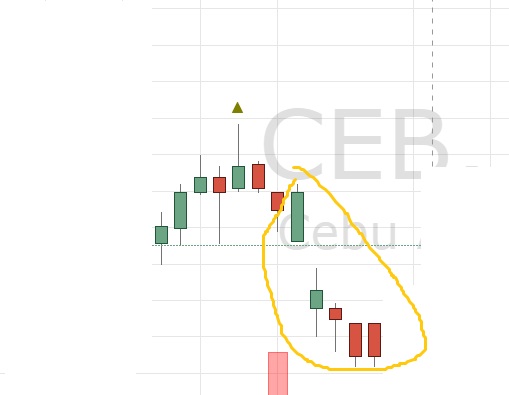
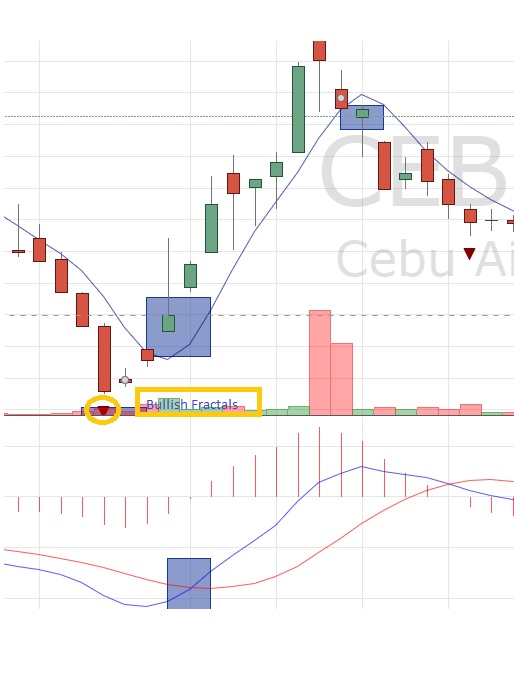
Plot natin sa chart

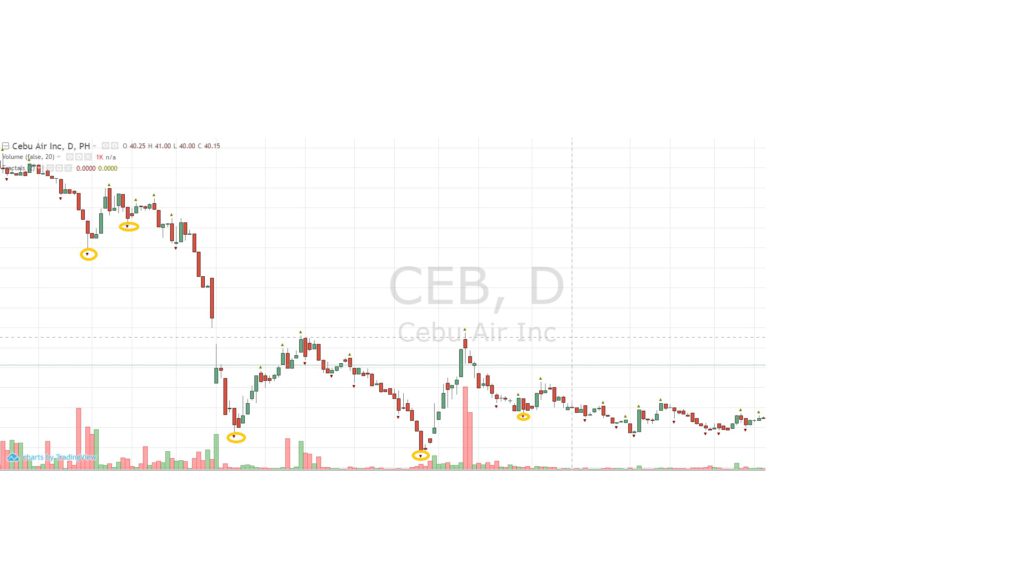
May red na arrow pababa sa middle candle. Yan ang fractals sa chart. Bullish fractals ibig sabihin ng arrow sa baba ng candle. Meaning yung low ng middle candle ay mas mababa kesa dun sa low ng dalawang candle before niya at after niya
Ang result after ng Bullish Fractals ay umaakyat yung price.
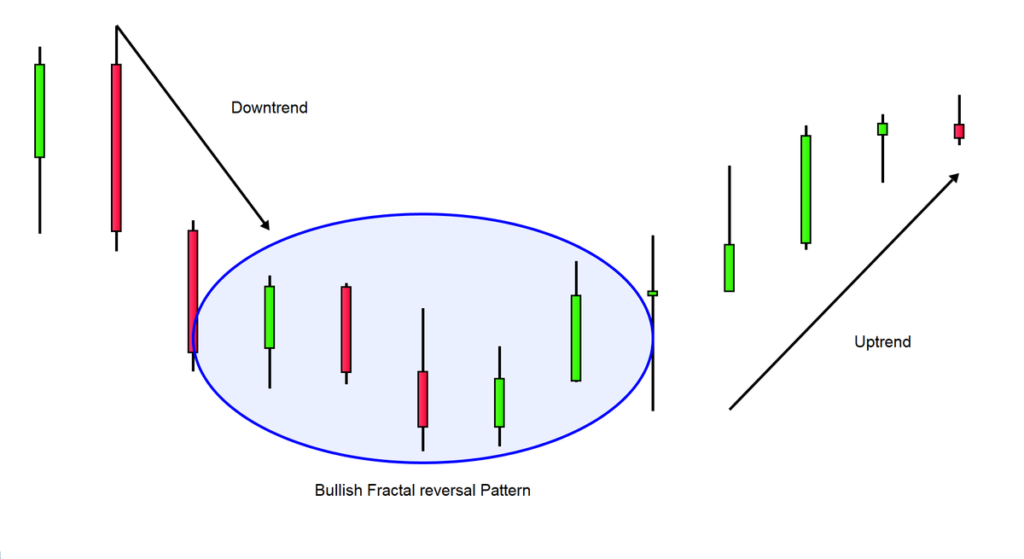
FRACTAL REVERSAL PATTERNS
- A bullish fractal implies that a downtrend has reached an end and that a new uptrend may be ensuing.
- A bearish fractal implies that an uptrend has reached an end and that a new downtrend may be ensuing
THE PROBLEM NUMBER 1: FAKE SIGNALS
Napaliwanag ko na kung ano yung Fractals.
Now talakayin natin yung problema sa fractals.
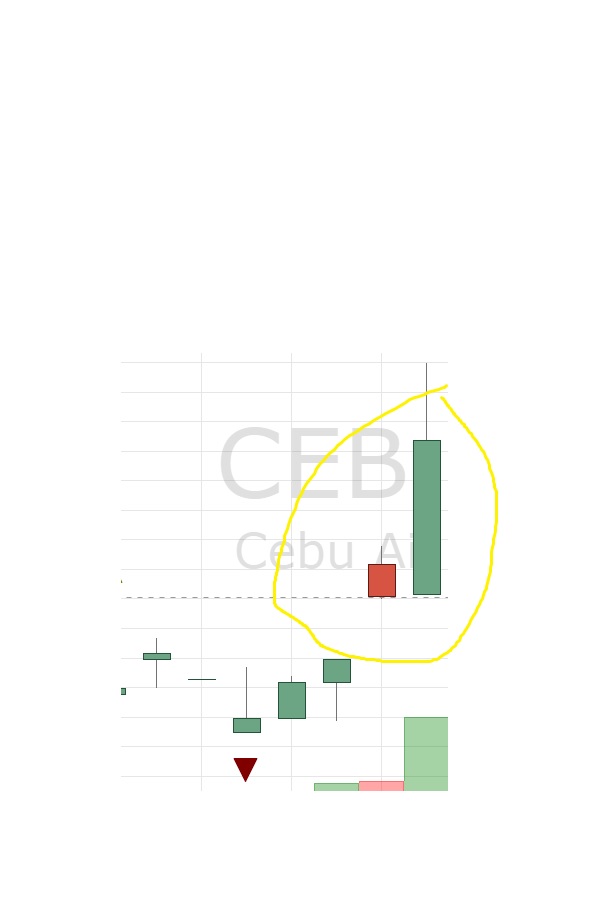
Look closer sa charts. Hanap tayo Bullish Fractals na after niya magpakita ay umangat yung price.
Hanap tayo bearish fractals na after niya magpakita eh bumagsak yung price.
Ang problema is….
Sobrang dami ng fractals na nagbibigay fake signals.
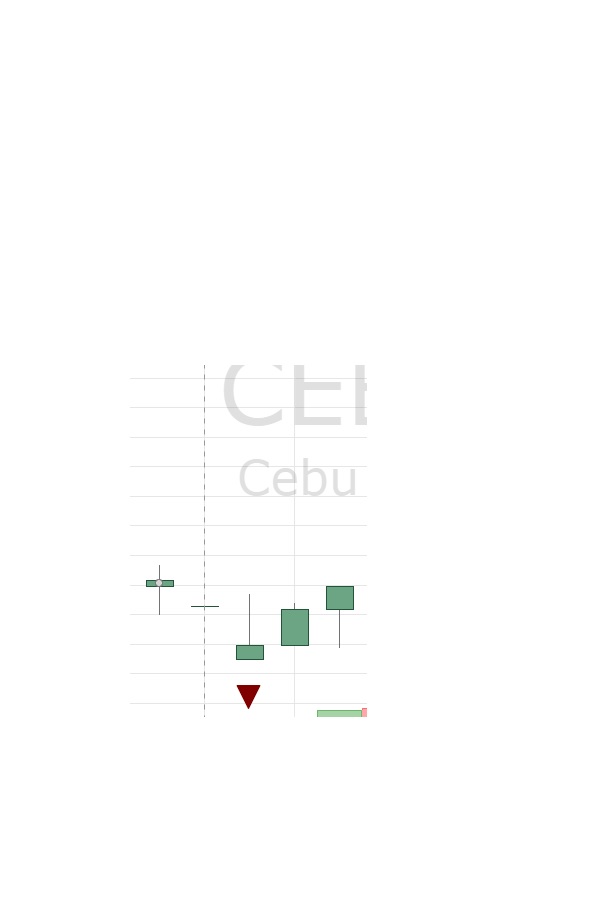
Bullish Fractal fake signals.
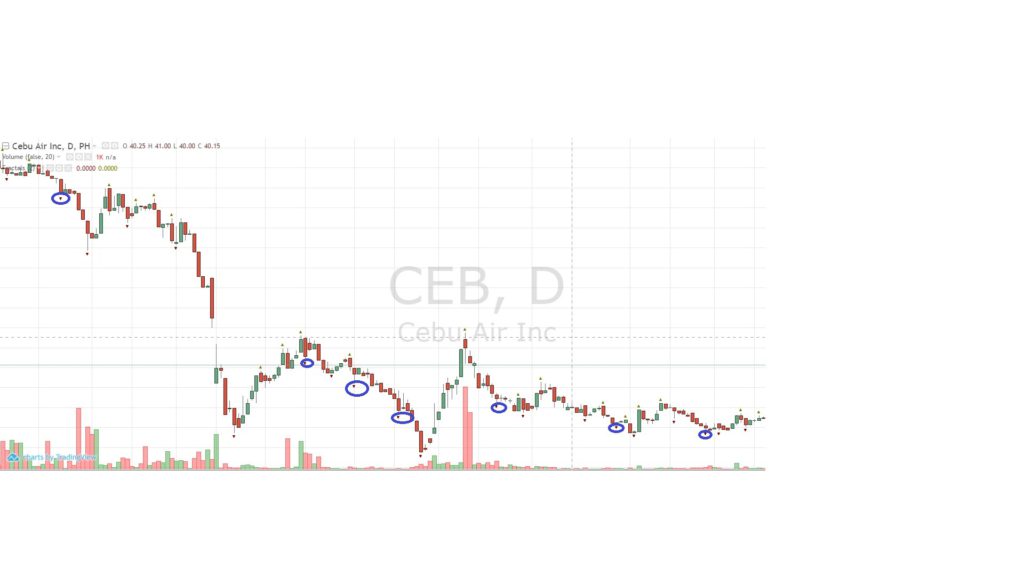
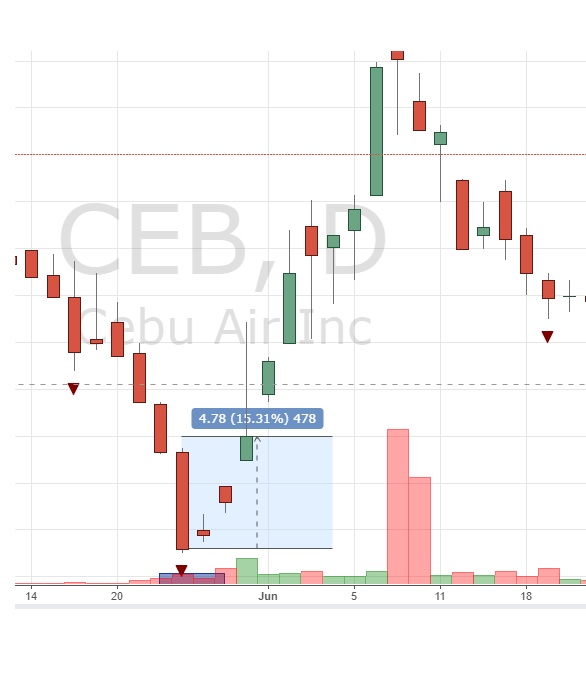
Bullish Fractals nagpakita pero bagsak pa rin ang price after.
Heto naman ang Bearish Fractals na fake signal.
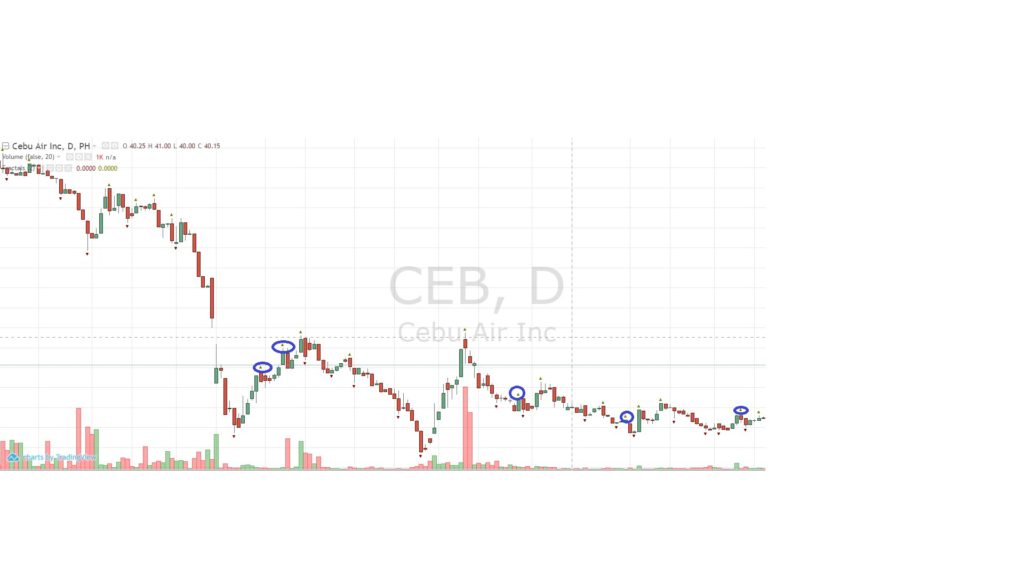
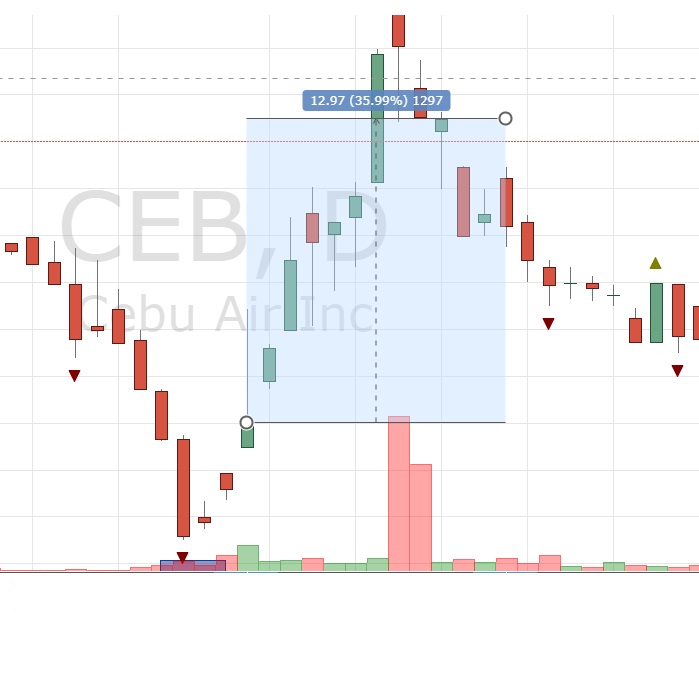
Meaning nagpakita na ang Bearish fractals pero umangat pa rin yung price.
If eh trade mo ang fractals alone mauubos lang pera mo sa fake signals.
PROBLEM NUMBER 2: RISK
Kaya ayaw ko sa mga patterns eh dahil wala itong measurement ng risk.
Na discuss ko na yan sa isang blog nakaraan.
Yung Fractals diba sa definition niya kailangan niya 5 candles.
Lalabas lang ang fractals na arrow kapag may 5 candles na makasatisfy sa condition nito. That means 2 candles before at after ng middle candle. Meaning kapag bullish fractals makikita mo lang yung arrow after 2 candles (2 days).
Ok lang if magtuloy sa akyat.
Dun pa lang lalabas yung arrow so malayo ka na. Mataas na risk at di mo pa alam if fake yung signal. Paano if fake pala signal ng bullish fractals.
GAMIT NG FRACTALS
Heto ang mabisang gamit ng fractals.
USE IT FOR CONVICTION.
Let’s say MAMA ang gamit mo na strategy.
Pag plot mo ng MAMA at nakita mo sa entry mo may malapit na fractals eh di mas malakas conviction mo but still MAMA strategy ng entry at exit gamitin mo.
Pwede mo gamitin ang Fractals kapag di ka makadecide if eentry ka or eexit with ur own strategy.
Kunyare flat yung macd. MAMA siya pero flat ang MACD. If may nakita ka bullish fractals before eh di mas may conviction ka na pumasok.
Game of probabilities naman ang trading so hindi mo naman napipredict ang mangyayare sa future. This will give you more conviction sa trading decisions mo.
Kung wala kang maayos na strategy sa trading ay pwede mong maavail ang BABY 2.0 Strategy.
Avail BABY 2.0 COURSE here: https://forms.gle/ZD8LWWb5R2orC2V56
Kung nais mo naman matutong magtrade ng tama ay come and join us.
Learn how to trade forex, crypto, US stock market or Philippine stock market properly with us.
Avail it here:
https://bit.ly/47MQjLM
Heto ang result ng mga dating nagjoin.
(https://blogs.tradersdenph.com/kikita-ka-ba-talaga-kapag-sumali-ka-sa-tdsi-mentorship/)
(https://blogs.tradersdenph.com/tdsi-mentorship-resultskumita-nga-ba-ang-mga-nag-avail/)
Heto ang interviews ng mga nakagraduate na.
DO NOT MISS OUT!
You deserve to at least try!
Proper trading approach made it possible for us to earn these:
Trading is risky and dangerous kapag mali ang approach mo but rewarding ito ng sobra kapag tama ang approach mo.
You can succeed in trading at pwede ka naman din magfail but at least you had the opportunity to at least try.
You deserve that chance to try.
Try it now! REGISTER HERE: https://forms.gle/3YnEJZNjzcHguEDP7

Visit our social media channels!
For more trading materials, visit our official website here: Home – Traders Den PH
For trading books, visit our Official Shopee store:
To join our growing community, visit our Facebook Group TRADERS DEN PH FACEBOOK GROUP
