HEATMAP Part 2 (Paano Gamitin?)
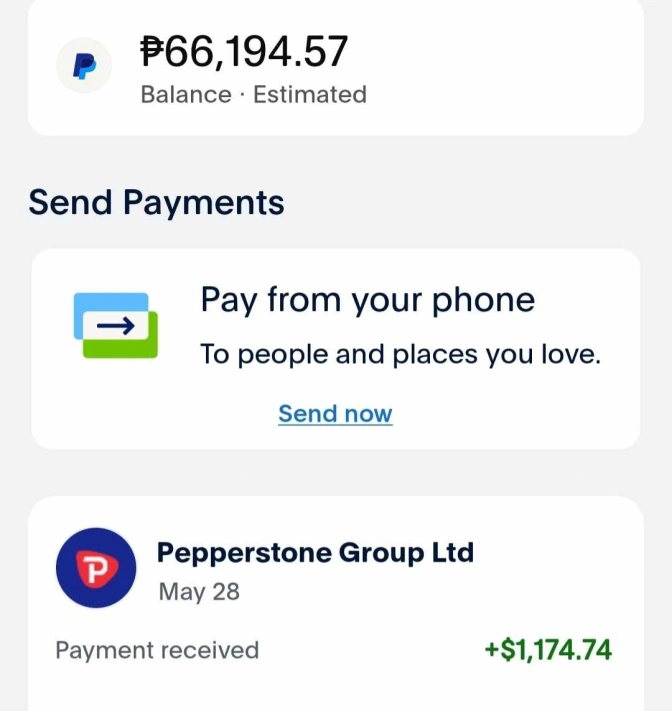
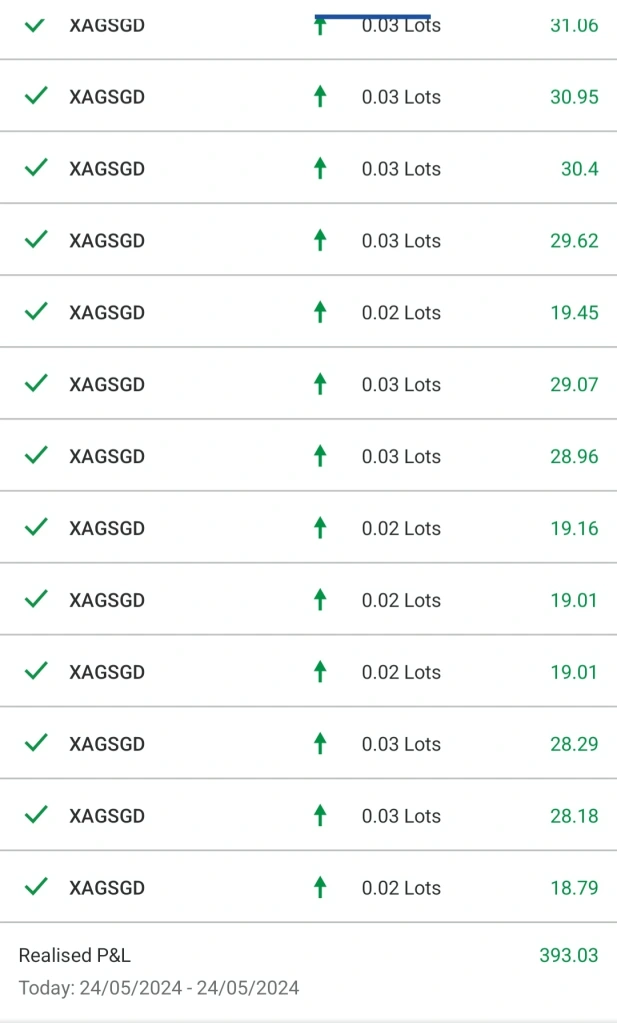
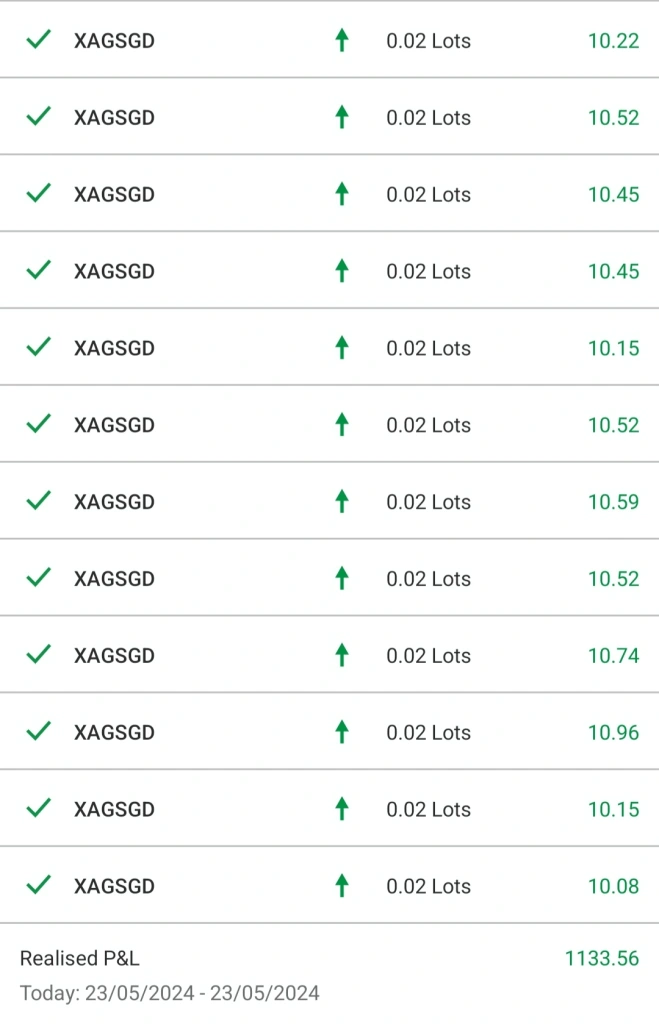
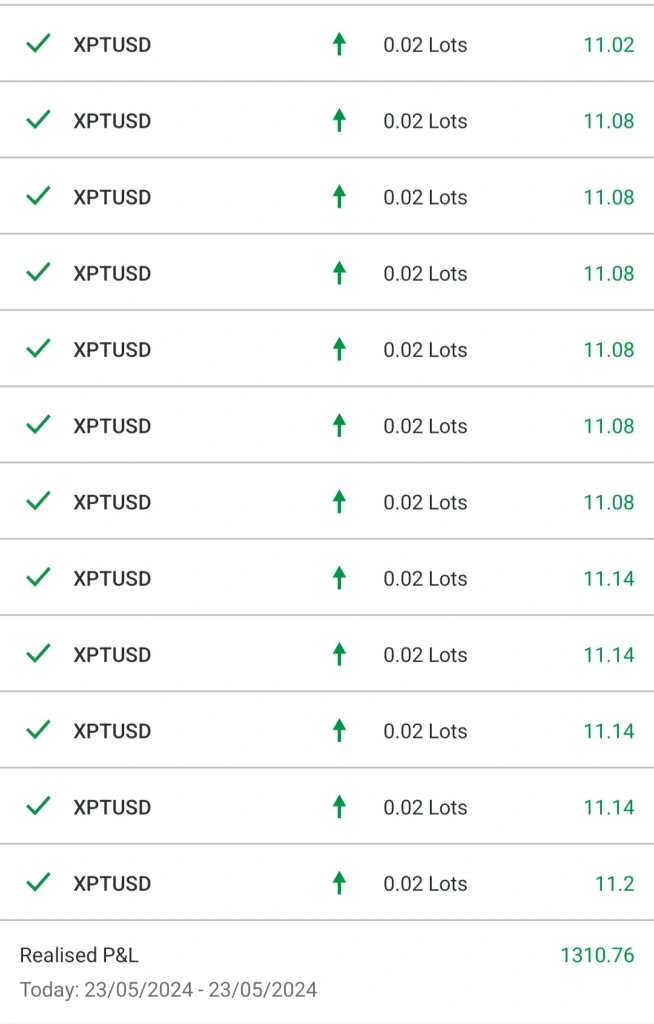
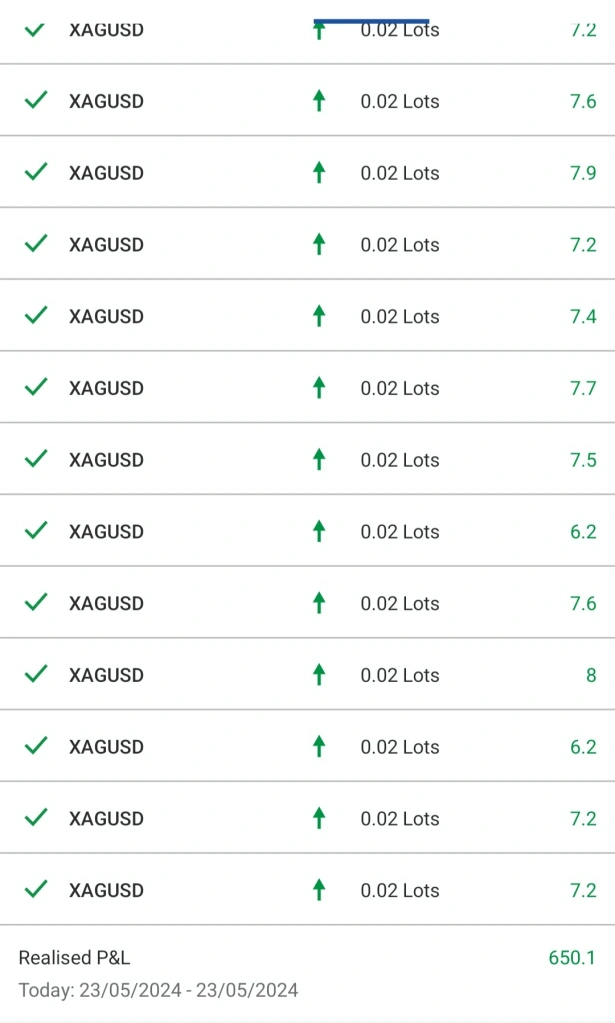
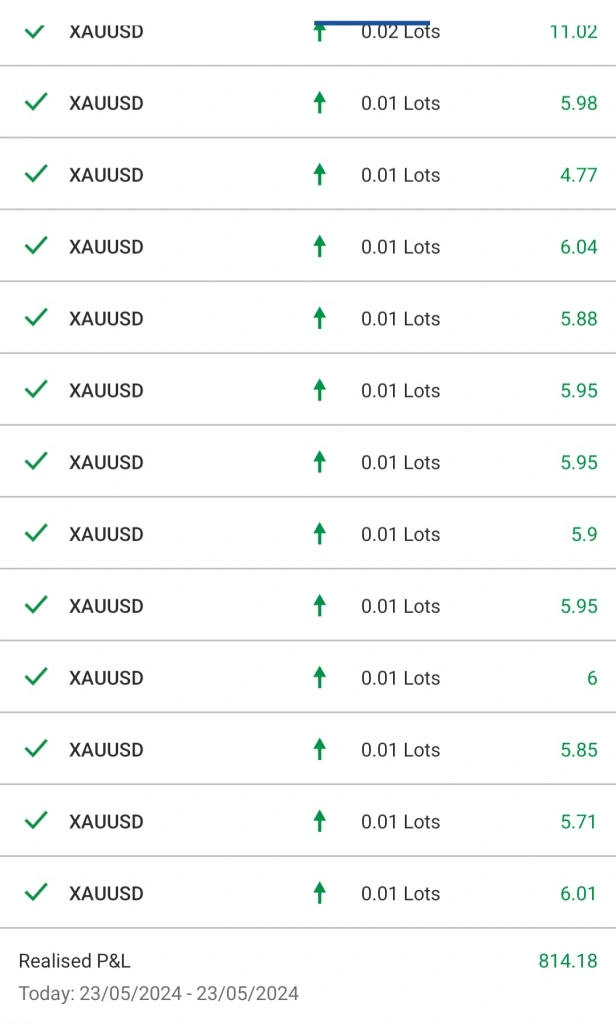
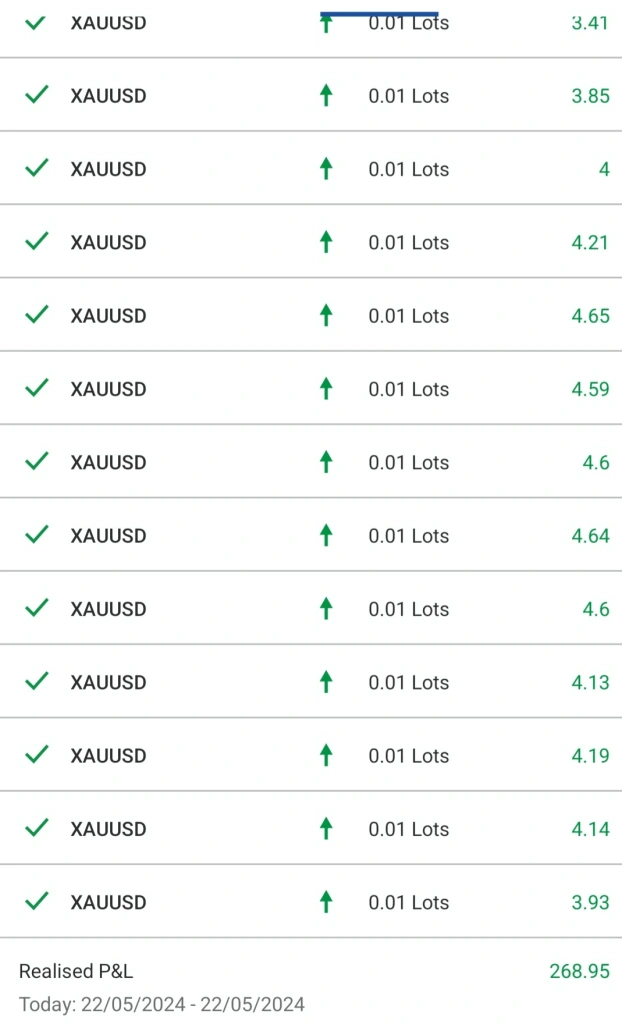
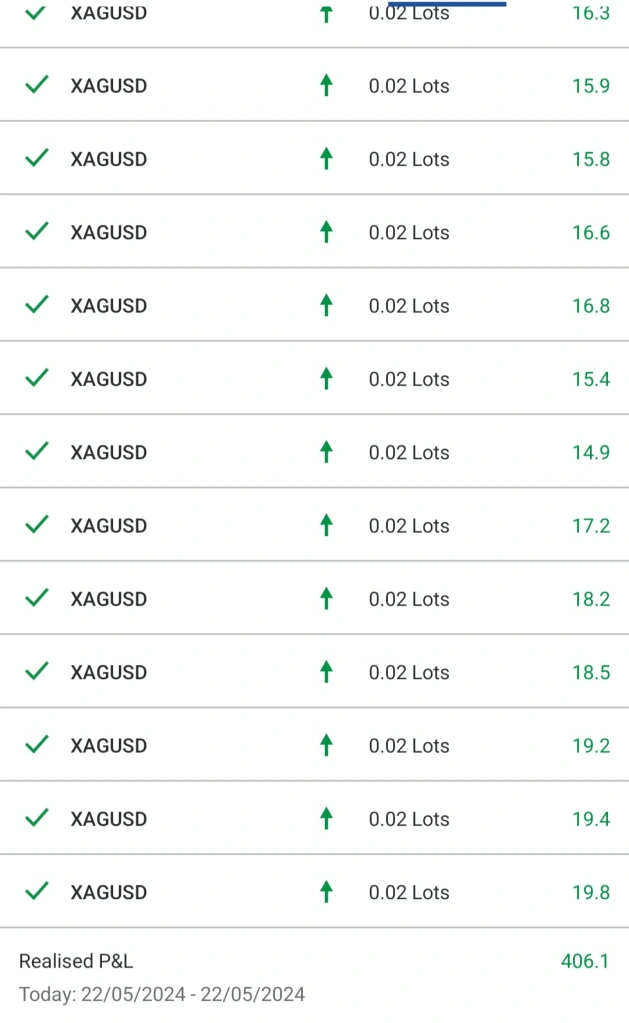
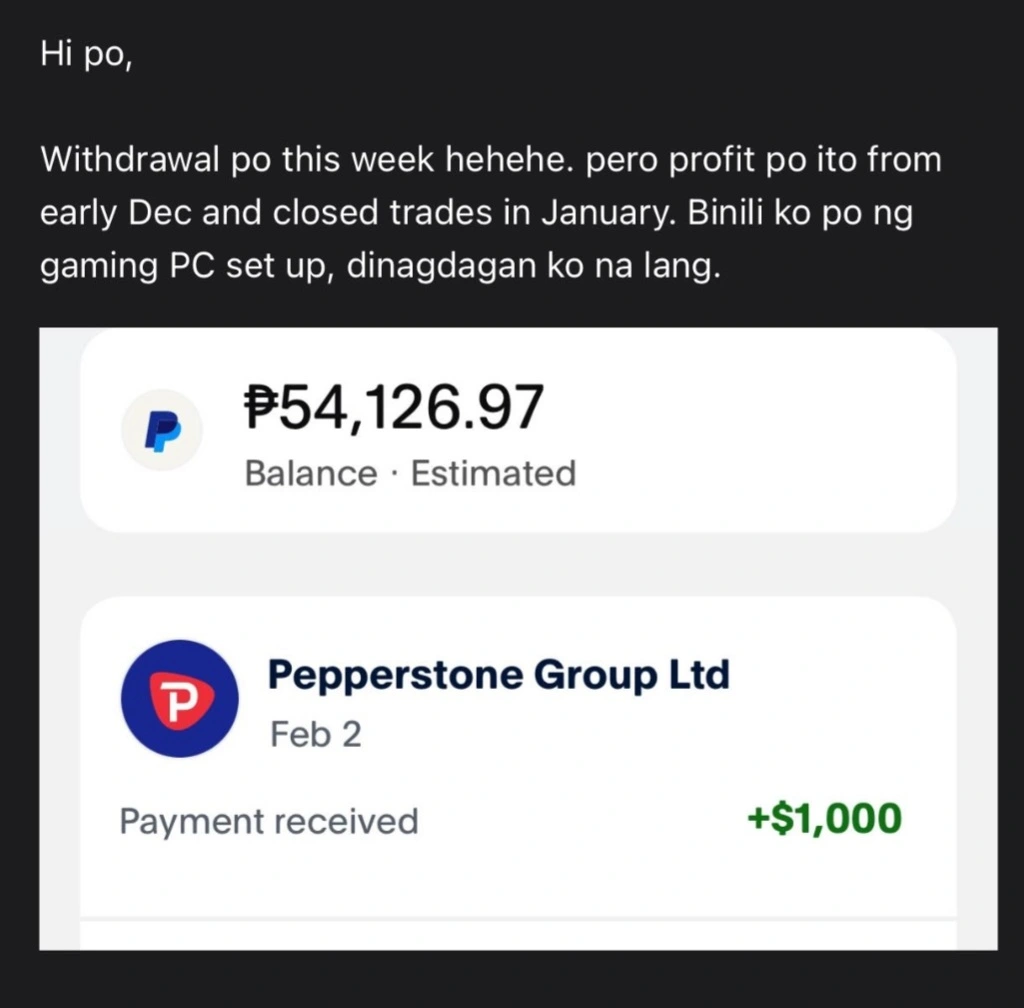
MIDAS TOUCH strategy used in Precious Metals market gave me profits this week kaya locked in at withdraw na ang ginawa ko.
66,000 pesos plus ang nilock in ko mula sa mga profits few days ago.
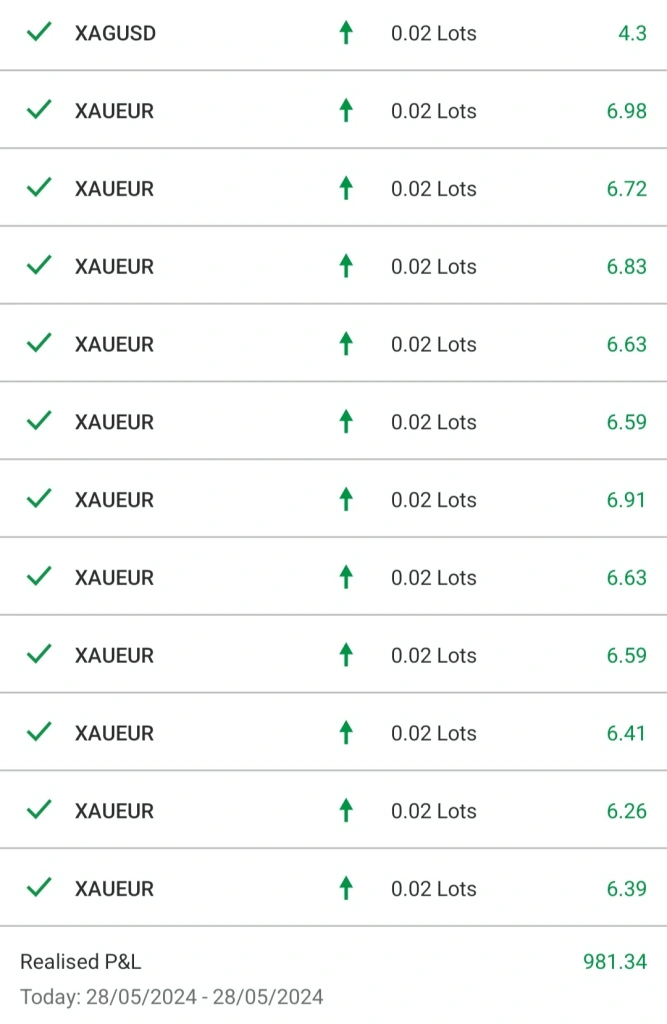
Ang sarap magscalp dito on lower timeframes kapag alam mo ang tamang approach at gamit mo ang MIDAS TOUCH.
Simpleng pagscalp lang ay 25,000 pesos profit na agad!
Trading can be a good source of income outside sa trabaho or negosyo mo.
Hindi lang pera ang naooffer ng trading but also freedom. Hawak mo ang oras mo. Ikaw ang gumagawa ng decisions pagdating sa pera mo.


Panahon na pa itry mo ang pagtitrade ng GOLD, SILVER at iba pang PRECIOUS METALS throughout TDSI PRECIOUS METALS Mentorship.
Wag kang magpapaiwan.
Do not miss out!
Avail it here: https://form.jotform.com/241343355885462

I discussed heatmap sa unang blog.
Let’s discuss it even further on this blog.
No Sectors
Up until now ay nasa different sectors pa din tayo.
Kung nais mo na individual stocks lang ang makita mo at hindi sila grouped into sectors ay pwede rin.
Punta ka lang sa “group by” then select no group.
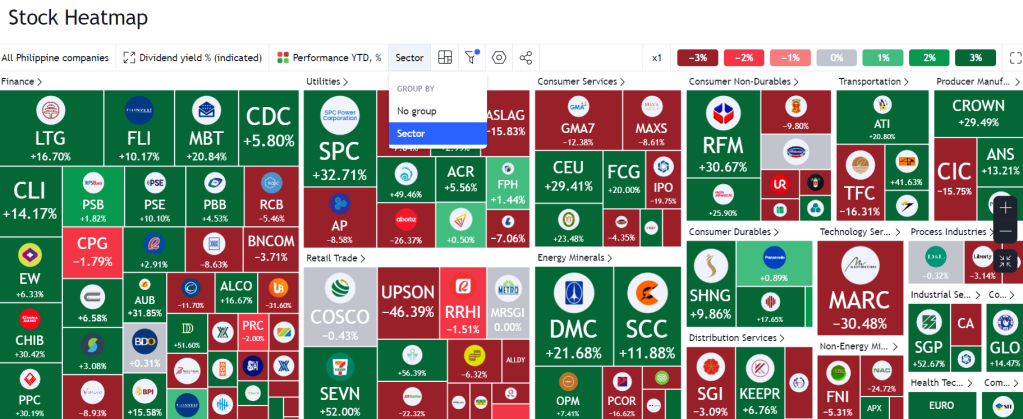
If you do that ay masosort sila by individual stock at hindi na by sectors.
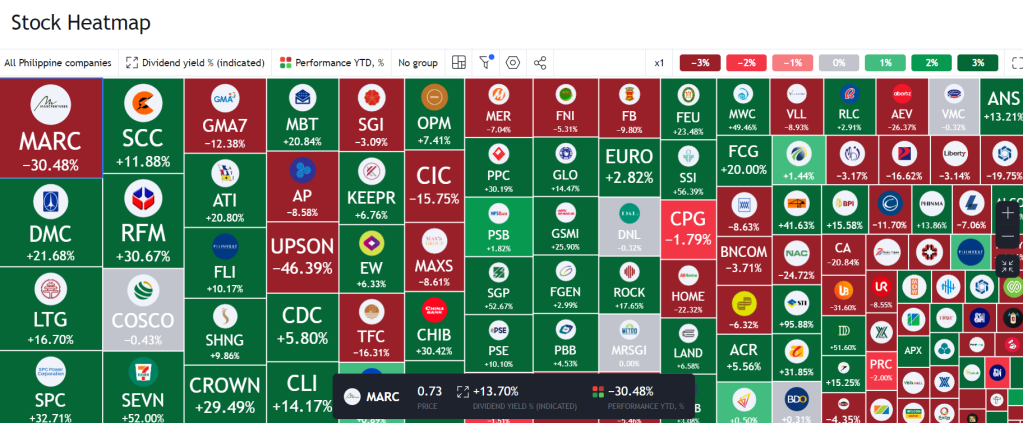
Let’s try dividend yield % as our size. YTD pa din na performance.
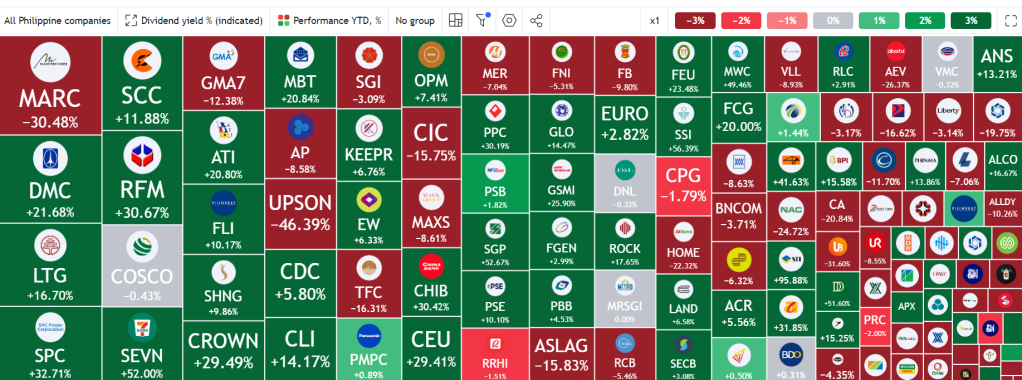
As you can see ay si MARC na ang pinakamalaki na box kasi if you hover kay MARC ay makikita mo na 13.70% ang dividend yield niya. Yung -30.48% sa ilalim ni MARC ay YTD performance niya yan so do not get confused.
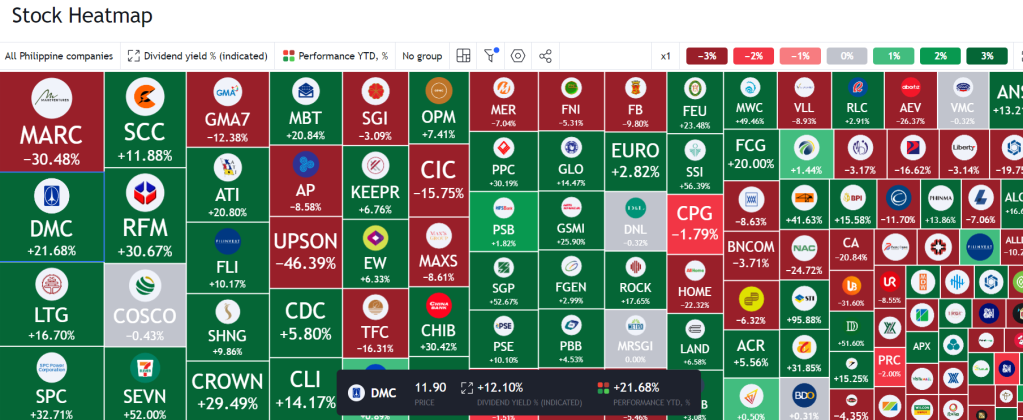
Next na size ng box kay MARC ay si DMC which has 12.10% dividend yield if ihover mo ang mouse mo sa kanya.
Volume
Instead na Market Cap ay volume ang ilagay natin sa size.
This is what we get.
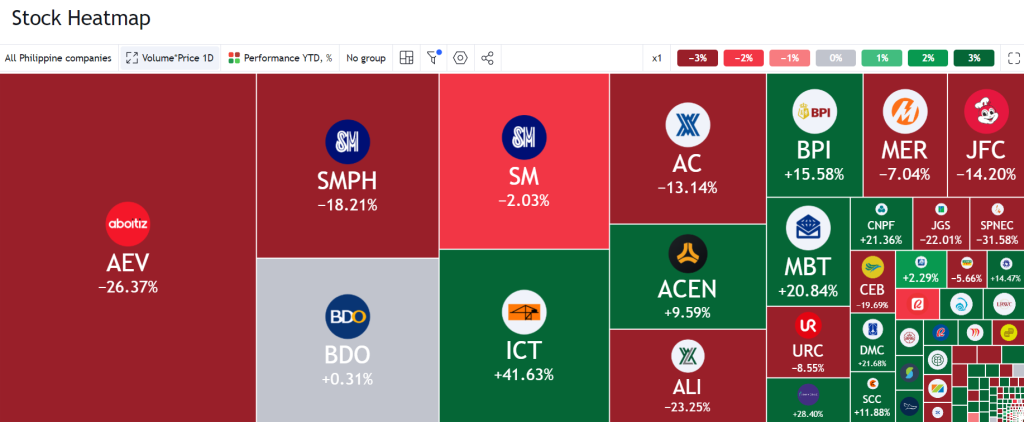
The same na sa ACTIVE stocks ng COL excepts sa percentage under the stock code kasi nakaYTD pa.
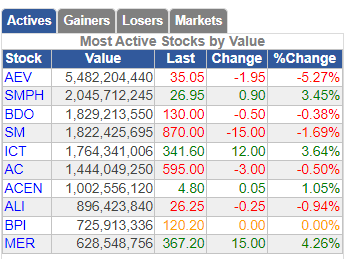
If we switch to DAY instead YTD sa performance ay the same na sila.
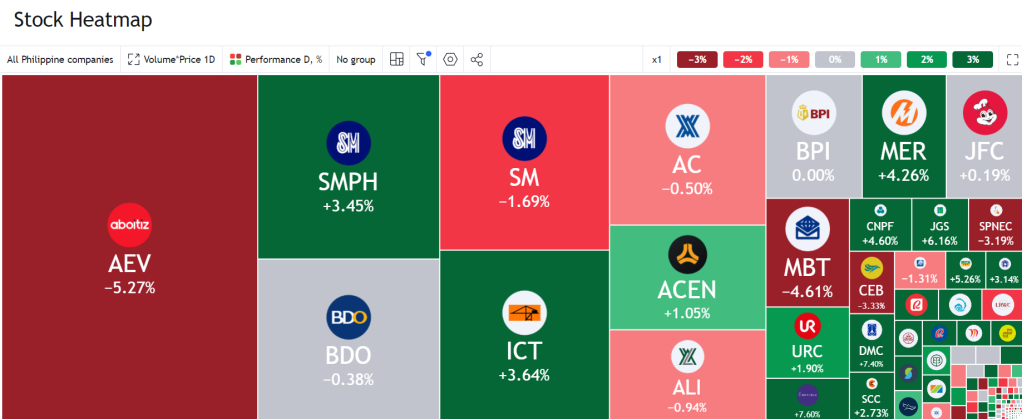
The most traded stocks for the day na ang nakikita mong nasa malalaking box.
Important Thing To Remember
Ang pansort mo ay nasa size.
Yung performance will just show you the performance or the percent gain/loss ng mga nasort mo na via size.
If you choose market cap ay lalabas ang mga may malalaking market cap na stock. Kung papalitan mo ang performance either day, month or ytd, yung number lang sa baba ng stock code ang magbabago and that number is the percent gain/loss depende kung anong timeframe ang ipinalit mo. Kung YTD ay YTD na gain/loss number ang lalabas.
You will be able to see how the stock,na nasort mo na sa size, perform on Day, Week, Month, YTD, etc. by changing performance.
Ano Ang Gamit Ng Heatmap?
Ano ba ang gamit ng heatmap talaga?
Bird’s-eye view ng market. Its just an easy way to see what is happening inside the market.
Isang glance mo lang ay alam mo kung ano nangyayare in general sa market.
As to its usage para sa specific trade ay masasabi ko na hindi siya ganun ka useful since it is basically telling you what stock/sector is up or down ang kinaiba lang nito sa mga most active, top gainer at top loser ay color-coded siya na may different box size.
This can be helpful when you are filtering or screening tipong you just sit there and sort stocks via market cap, dividend yield or volume.
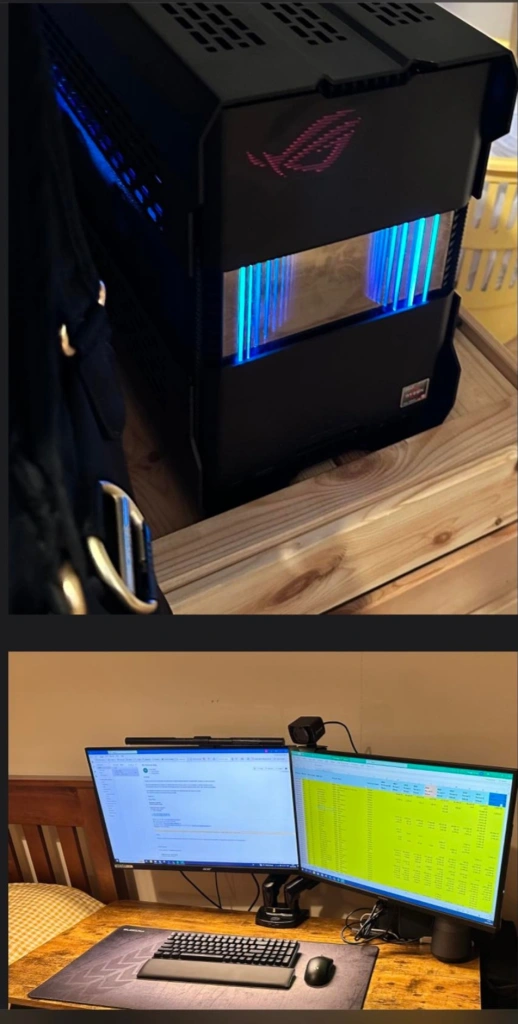
Cool din siya tingnan sa screen ng computer mo if may gusto kang iimpress na newbie or hindi trader. Haha!
Join our mentorship kung nais mong matutunan ang aming methods, ways, techniques at approach sa trading.
Learn how to trade forex, crypto, US stock market or Philippine stock market properly with us.
Avail it here:
https://bit.ly/47MQjLM
Heto ang result ng mga dating nagjoin.
(https://blogs.tradersdenph.com/kikita-ka-ba-talaga-kapag-sumali-ka-sa-tdsi-mentorship/)
(https://blogs.tradersdenph.com/tdsi-mentorship-resultskumita-nga-ba-ang-mga-nag-avail/)

Heto ang interviews ng mga nakagraduate na.
DO NOT MISS OUT!
You deserve to at least try!
Proper trading approach made it possible for us to earn these:
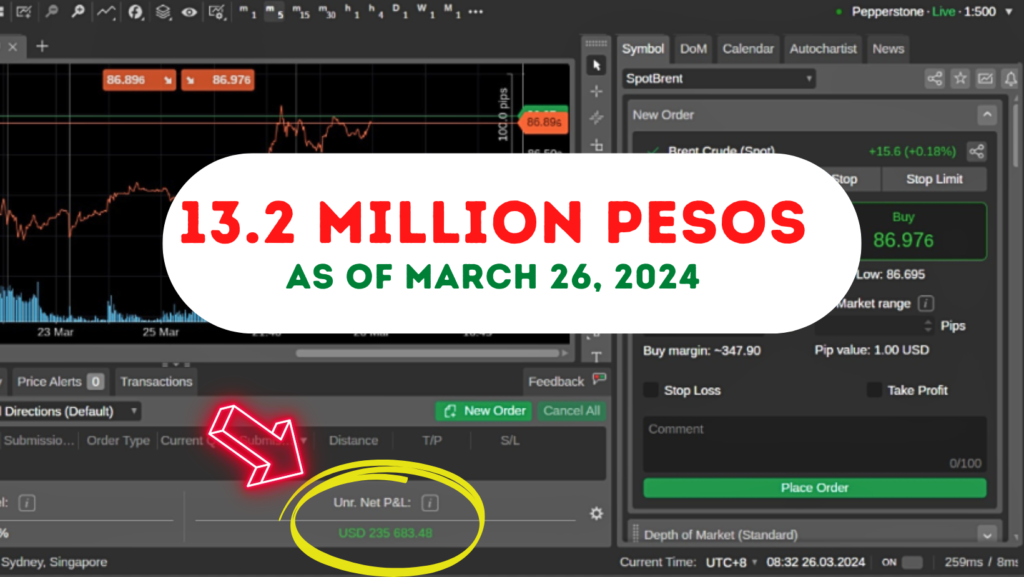
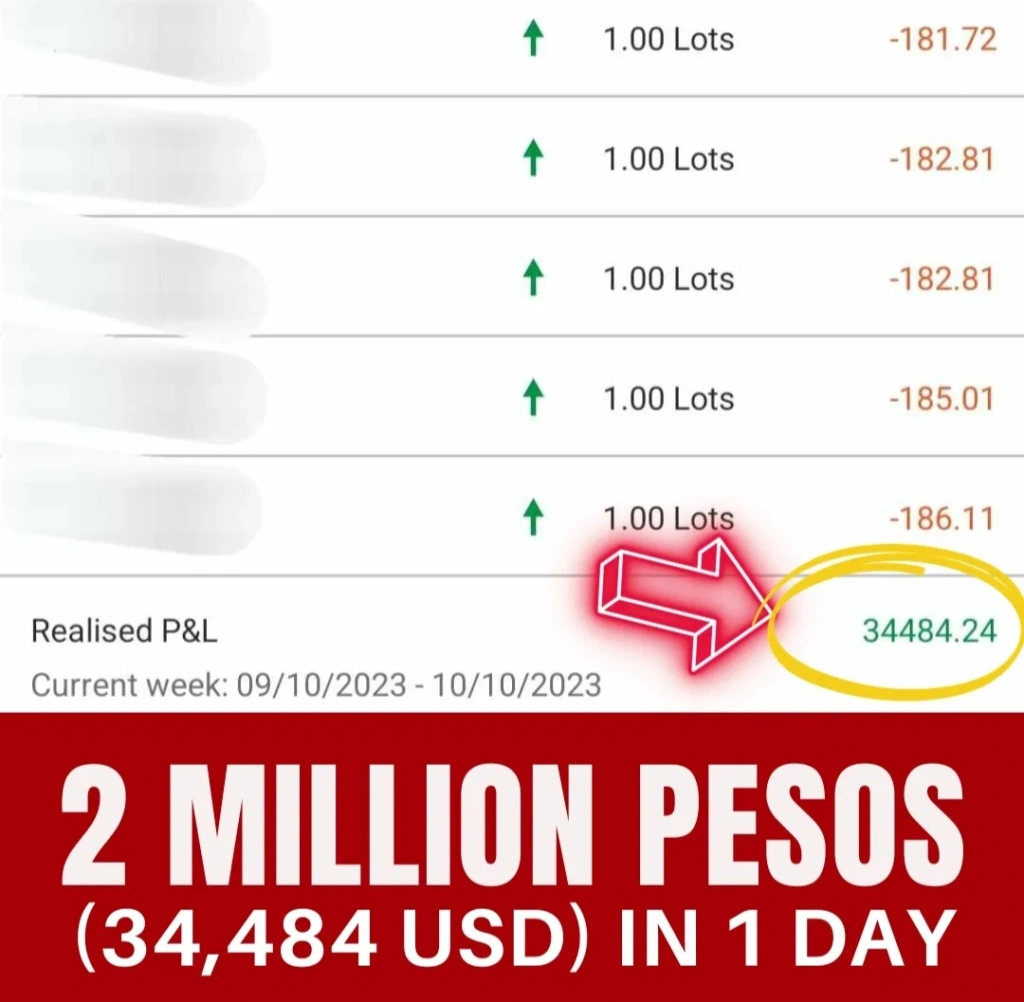
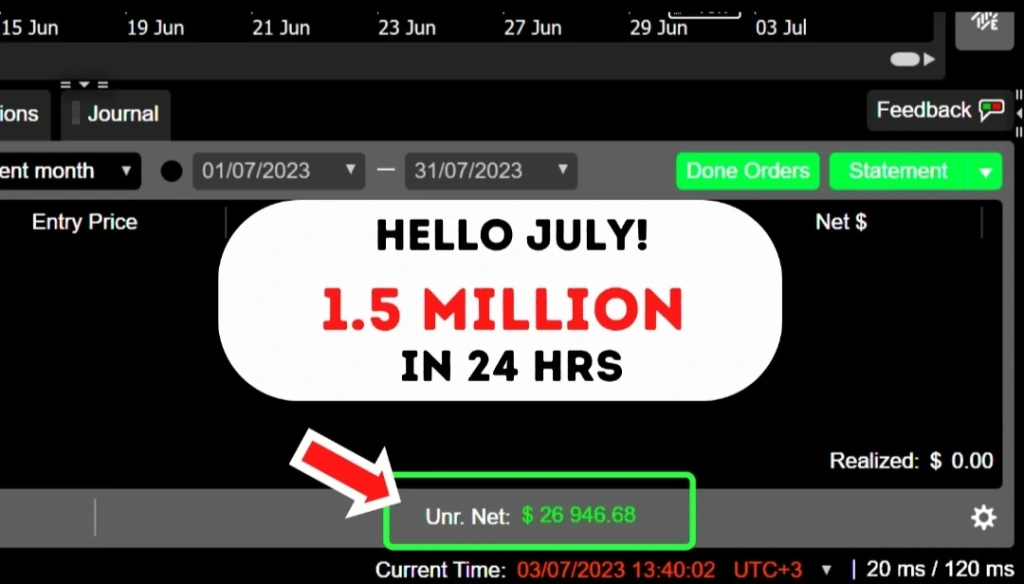
Trading is risky and dangerous kapag mali ang approach mo but rewarding ito ng sobra kapag tama ang approach mo.
You can succeed in trading at pwede ka naman din magfail but at least you had the opportunity to at least try.
You deserve that chance to try.
Try it now! REGISTER HERE: https://forms.gle/3YnEJZNjzcHguEDP7

Visit our social media channels!
For more trading materials, visit our official website here: Home – Traders Den PH
For trading books, visit our Official Shopee store:
To join our growing community, visit our Facebook Group TRADERS DEN PH FACEBOOK GROUP

